Data from NASA shows the Earth gradually heating up since the late 19th century. Since the year 2000, this trend seems to have accelerated as shown in the visualization of the data. December 2020 was just 1.34° C colder than the average month recorded on Earth since 1880. In past decades, December was frequently 2 to 2.5° C colder. Key: Red: 2020, Green: 2000, Yellow: 1960, Orange: 1920.
The Earth's climate has changed throughout history. Just in the last 650,000 years there have been seven cycles of glacial advance and retreat, with the abrupt end of the last ice age about 7,000 years ago marking the beginning of the modern climate era — and of human civilization. Most of these climate changes are attributed to very small variations in Earth’s orbit that change the amount of solar energy our planet receives.
Earth-orbiting satellites and other technological advances have enabled scientists to see the big picture, collecting many different types of information about our planet and its climate on a global scale. This body of data, collected over many years, reveals the signals of a changing climate.
Ice cores drawn from Greenland, Antarctica, and tropical mountain glaciers show that the Earth’s climate responds to changes in greenhouse gas levels. Ancient evidence can also be found in tree rings, ocean sediments, coral reefs, and layers of sedimentary rocks. This ancient, or paleoclimate, evidence reveals that current warming is occurring roughly ten times faster than the average rate of ice-age-recovery warming.
The evidence for rapid climate change is compelling:
Gases that contribute to the greenhouse effect include:
- Water vapor. The most abundant greenhouse gas, but importantly, it acts as a feedback to the climate. Water vapor increases as the Earth's atmosphere warms, but so does the possibility of clouds and precipitation, making these some of the most important feedback mechanisms to the greenhouse effect.
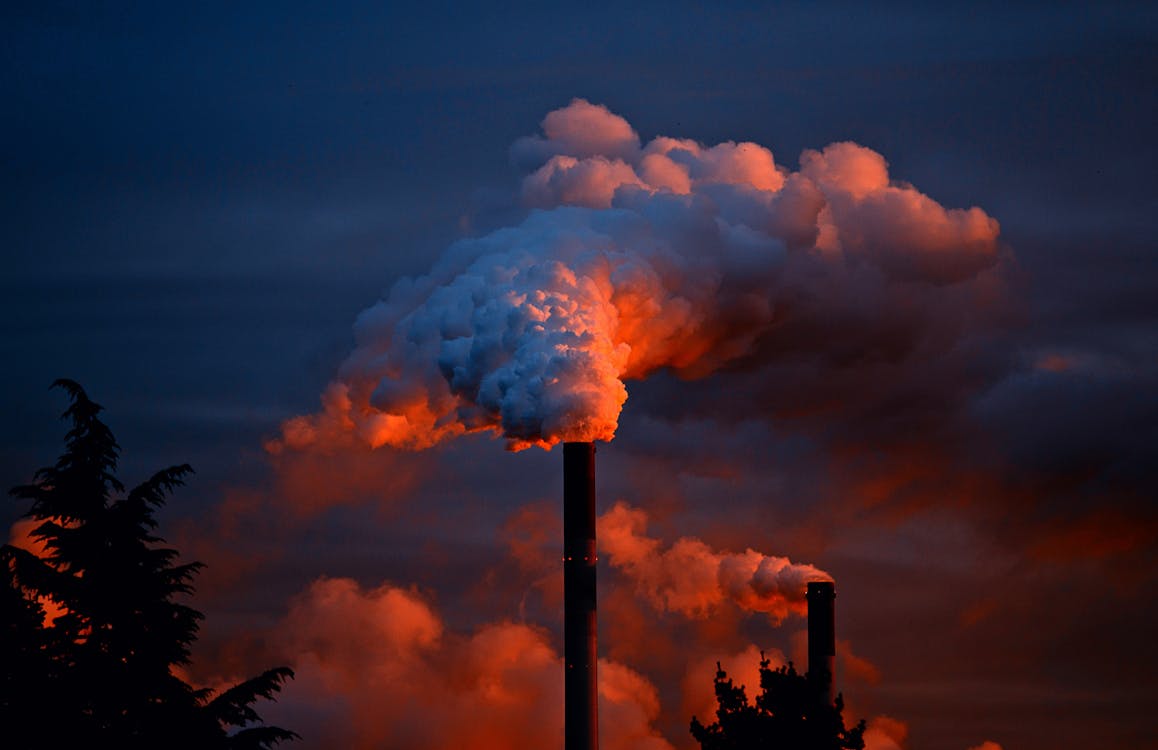
- Carbon dioxide (CO2). A minor but very important component of the atmosphere, carbon dioxide is released through natural processes such as respiration and volcano eruptions and through human activities such as deforestation, land use changes, and burning fossil fuels.

- Methane. A hydrocarbon gas produced both through natural sources and human activities, including the decomposition of wastes in landfills, agriculture, and especially rice cultivation, as well as ruminant digestion and manure management associated with domestic livestock.
- Nitrous oxide. A powerful greenhouse gas produced by soil cultivation practices, especially the use of commercial and organic fertilizers, fossil fuel combustion, nitric acid production, and biomass burning.
- Chlorofluorocarbons (CFCs). Synthetic compounds entirely of industrial origin used in a number of applications, but now largely regulated in production and release to the atmosphere by international agreement for their ability to contribute to destruction of the ozone layer. They are also greenhouse gases.
Global climate change has already had observable effects on the environment.
Glaciers have shrunk, ice on rivers and lakes is breaking up earlier, plant and animal ranges have shifted and trees are flowering sooner. Effects that scientists had predicted in the past would result from global climate change are now occurring: loss of sea ice, accelerated sea level rise and longer, more intense heat waves.
Scientists have high confidence that global temperatures will continue to rise for decades to come, largely due to greenhouse gases produced by human activities. The Intergovernmental Panel on Climate Change (IPCC), which includes more than 1,300 scientists from the United States and other countries, forecasts a temperature rise of 2.5 to 10 degrees Fahrenheit over the next century.
Future Effects
Temperatures Will Continue to Rise
One of the most immediate and obvious effects of global warming is the increase in temperatures around the world. The average global temperature has increased by about 1.4 degrees Fahrenheit (0.8 degrees Celsius) over the past 100 years, according to the National Oceanic and Atmospheric Administration
- NOAA
- Deforestation which leads to increased amount of CO2 in the atmosphere
- Burning of fossil fuels
- Use of too much of heavy duty as well as light vehicles that use CO2 producing fuels
- Production of electricity by burning coal & natural gas instead of alternative sources
Changes in Precipitation Patterns
Warmer air can hold more water, so rainfall is increasing on average across the world. In some places, rainfall is becoming more intense as well. However, some areas receive less rain because of changes in wind patterns.
- Met Office
- As we are well aware, moisture availability from precipitation is unequally distributed across the Earth. The geographic pattern of precipitation is explained by examining the spatial distribution of air masses, water availability through evaporation, and uplift mechanisms. One of the most important climate elements is the influence of the global pressure systems
More Droughts and Heat Waves
Heat can exacerbate drought, and hot dry conditions can in turn create wildfire conditions. In cities, buildings roads and infrastructure can be heated to 50 to 90 degrees hotter than the air while natural surfaces remain closer to air temperatures.
- C2ES
- A heatwave occurs when a system of high atmospheric pressure moves into an area and lasts two or more days. In such a high-pressure system, air from upper levels of our atmosphere is pulled toward the ground, where it becomes compressed and increases in temperature.
Sea Level Will Rise 1-4 feet by 2100
Long-term measurements of tide gauges and recent satellite data show that global sea level is rising, with the best estimate of the rate of global-average rise over the last decade being 3.6 mm per year (0.14 inches per year). The rate of sea level rise has increased since measurements using altimetry from space were started in 1992; the dominant factor in global-average sea level rise since 1970 is human-caused warming. The overall observed rise since 1902 is about 16 cm (6 inches).
- The Royal Society
- The two major causes of global sea level rise are thermal expansion caused by warming of the ocean (since water expands as it warms) and increased melting of land-based ice, such as glaciers and ice sheets.
Scientific Consensus
Statement on Climate Change from 7 Scientific Associations

New Scientist
2002Parliaments in the European Union, Japan and others ratify Kyoto. But the protocol’s complicated rules require ratification by nations responsible for 55% of industrialised country emissions, before it can come into force. After Australia joins the US in reneging on the deal, Russia is left to make or break the treaty, but hesitates. Meanwhile, the world experiences the second hottest year on record and Antarctica’s Larsen B ice sheet breaks up.
ACS
2004Comprehensive scientific assessments of our current and potential future climates clearly indicate that climate change is real, largely attributable to emissions from human activities, and potentially a very serious problem.
AMA
2006, 2007AMA supports the findings of the Intergovernmental Panel on Climate Change’s fourth assessment report and concurs with the scientific consensus that the Earth is undergoing adverse global climate change and that anthropogenic contributions are significant.
GSA
2013Human‐induced climate change requires urgent action. Humanity is the major influence on the global climate change observed over the past 50 years. Rapid societal responses can significantly lessen negative outcomes.

IPCC
2018An IPCC special report on the impacts of global warming of 1.5 °C above pre-industrial levels and related global greenhouse gas emission pathways, in the context of strengthening the global response to the threat of climate change, sustainable development, and efforts to eradicate poverty.
Carbon Dioxide
Latest Measurement: August 2019
412 ppm
Carbon dioxide (CO2) is an important heat-trapping (greenhouse) gas, which is released through human activities such as deforestation and burning fossil fuels, as well as natural processes such as respiration and volcanic eruptions. The first graph shows atmospheric CO2 levels measured at Mauna Loa Observatory, Hawaii, in recent years, with average seasonal cycle removed. The second graph shows CO2 levels during the last three glacial cycles, as reconstructed from ice cores.
The time series below shows global distribution and variation of the concentration of mid-tropospheric carbon dioxide in parts per million (ppm). The overall color of the map shifts toward the red with advancing time due to the annual increase of CO2.
Global Temperature
Latest Annual Average Anomaly: 2018
0.8 °C
This graph illustrates the change in global surface temperature relative to 1951-1980 average temperatures. Eighteen of the 19 warmest years all have occurred since 2001, with the exception of 1998. The year 2016 ranks as the warmest on record. (Source: NASA/GISS). This research is broadly consistent with similar constructions prepared by the Climatic Research Unit and the National Oceanic and Atmospheric Administration.
The time series below shows the five-year average variation of global surface temperatures. Dark blue indicates areas cooler than average. Dark red indicates areas warmer than average.
Ice Sheets
Antartica Mass Variation Since 2002
127.0
Gigatonnes/YearData from NASA's GRACE satellites show that the land ice sheets in both Antarctica (upper chart) and Greenland (lower) have been losing mass since 2002. Both ice sheets have seen an acceleration of ice mass loss since 2009. (Source: GRACE satellite data)
Please note that the most recent data are from June 2017, when the GRACE mission concluded science operations. Users can expect new data from GRACE’s successor mission, GRACE Follow-On, in the summer of 2019.
Sea Level
Latest Measurement: May 2019
3.3
Millimeters/YearData from NASA's GRACE satellites show that the land ice sheets in both Antarctica (upper chart) and Greenland (lower) have been losing mass since 2002. Both ice sheets have seen an acceleration of ice mass loss since 2009. (Source: GRACE satellite data)
Please note that the most recent data are from June 2017, when the GRACE mission concluded science operations. Users can expect new data from GRACE’s successor mission, GRACE Follow-On, in the summer of 2019.